The problem
The platform's homepage was a row of five cards: three for solar workflows and two for storage, each linking to a different part of the platform. It worked as a directory, but nothing on it changed from one visit to the next, so it gave buyers no reason to start their day on Anza.
Before: a row of links
Five cards, each linking to a different workflow. Nothing on the page changed between visits.
The shift
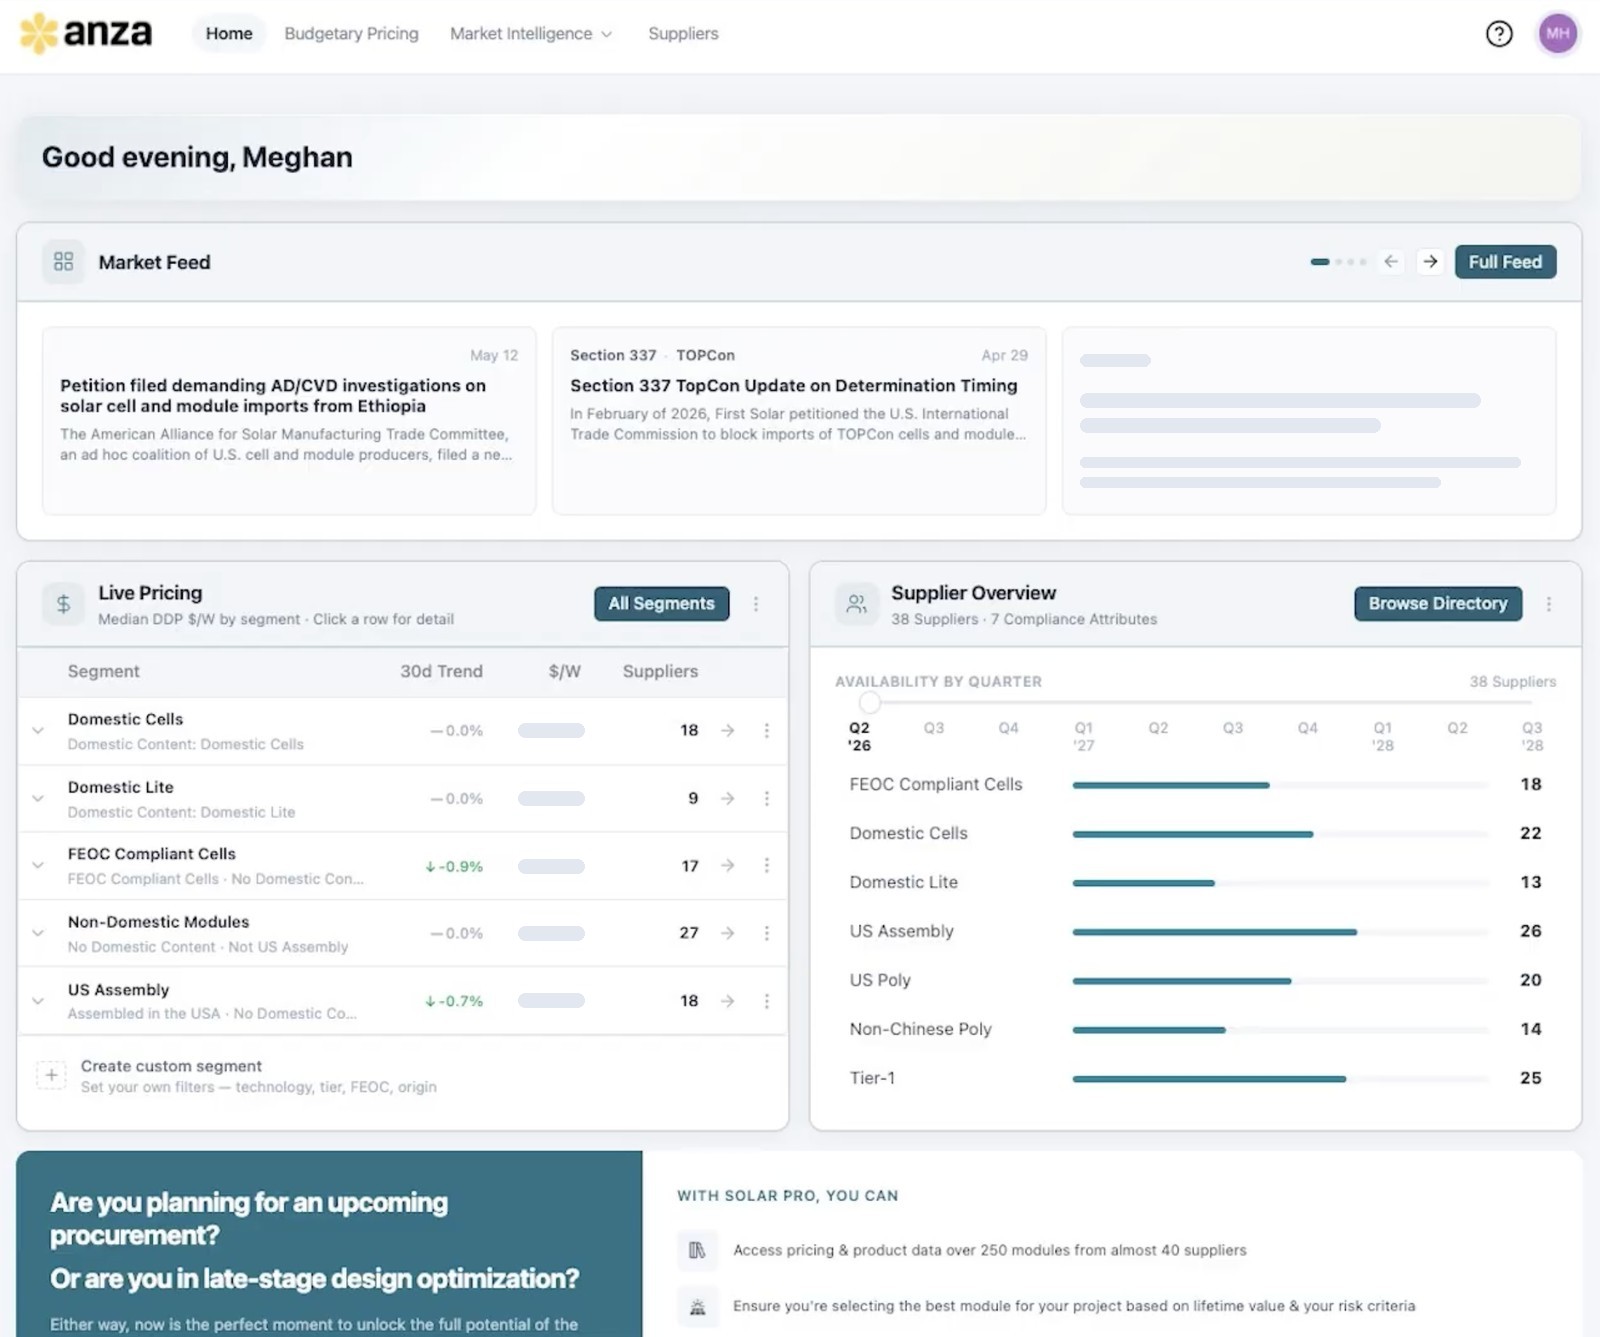
Solar Pulse turned the homepage into a dashboard built around what changes every day in a buyer's market: policy and supplier news, module pricing by segment, and which suppliers can deliver in which quarter. Each panel is a summary with a clear path into the detail behind it.
What I designed
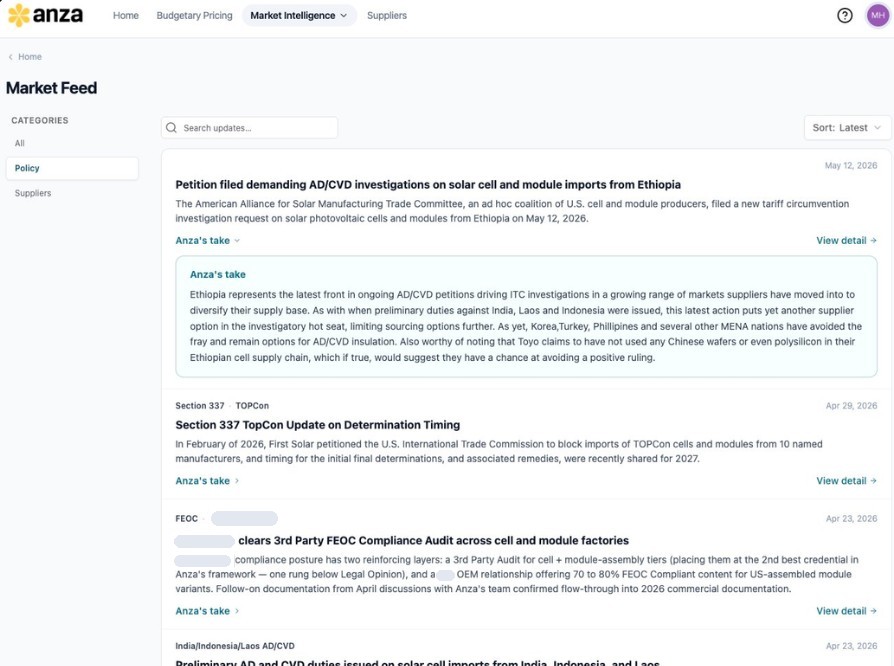
- Market Feed: policy and supplier updates with Anza's own take on each, filterable by category.
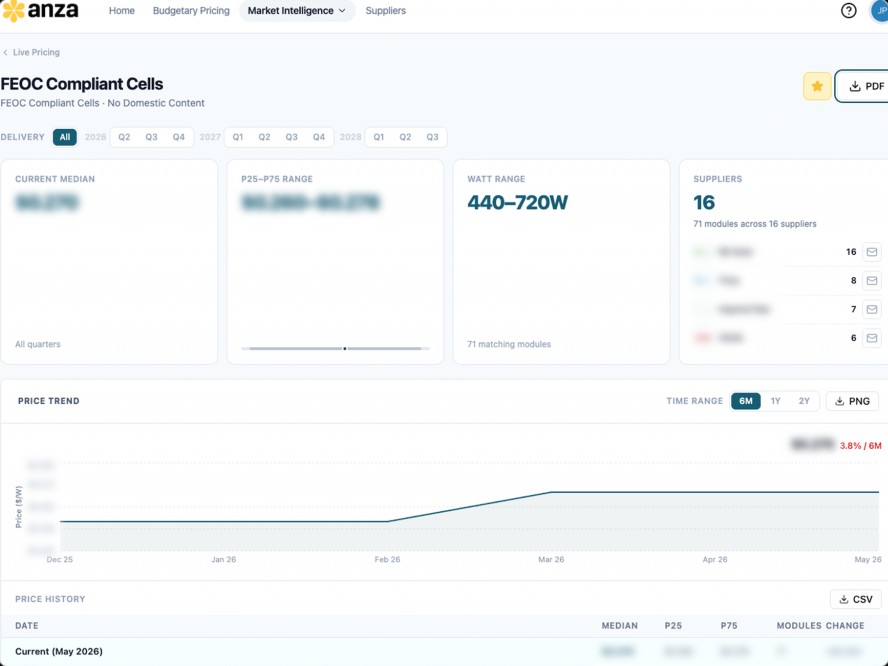
- Live Pricing: median price by segment with 30-day trends, custom segments, and a detail page for each segment with price ranges, history and the suppliers behind it.
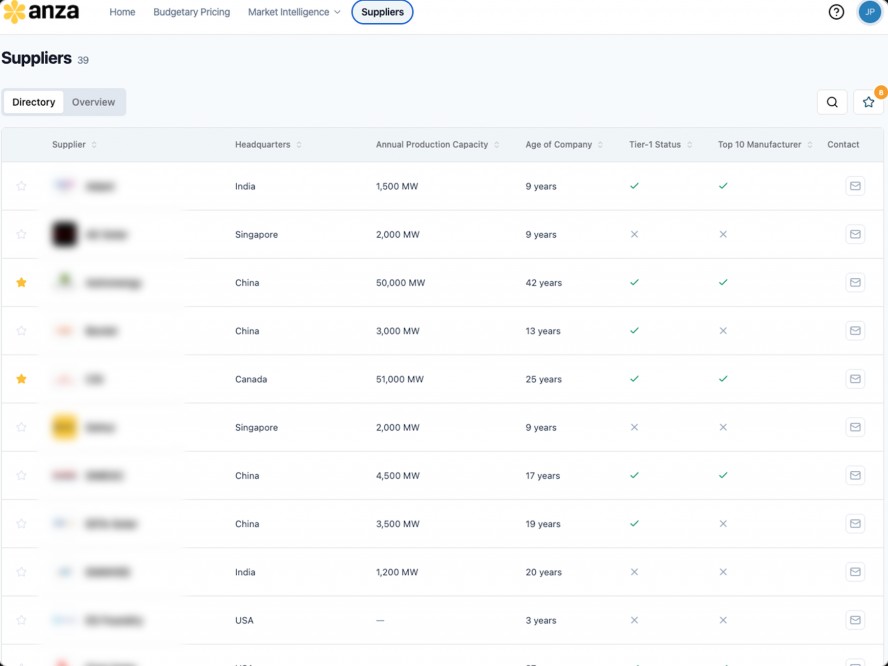
- Supplier Overview and directory: availability by quarter across compliance attributes, and a sortable directory of suppliers.
- A storage version of the dashboard, so both product lines shared one model.
The six-week experiment
Design, product and engineering had all started working with AI tools like Claude, and Anza's tech leadership wanted to see how fast that could take us. Solar Pulse, its storage version and the ES Storage Product Library became the test: three 0-to-1 products, from first design to release, in six weeks.
I used AI to prototype and explore directions quickly, and the design system meant everything I made was already in the components engineering was building from.
What happened
The new dashboard launched to customers on May 27, 2026, alongside the Product Library. Each month since, about 70% of customers who landed on it interacted with a widget, ranging from 62% to 79% over five months. Home also became more of a starting point: its share of all platform sessions rose from 22% to 28% in the four weeks after launch.
Usage concentrated in one place. The supplier overview carried the page, with a small group of power users returning to the quarter selector again and again. The market feed, which I'd expected to be the daily hook, barely got used.
One number cut the other way. Sessions that started on Home became less likely to continue to another page, dropping from 77% to 55%. That could mean the widgets answered the question so nobody needed to click through, or that the page became a dead end. The data can't tell which.
Reflection
What I'd push next. Find out which of those it is before adding anything, with a handful of customer calls and a look at what people do right after they leave Home. I'd also rethink the market feed rather than polish it. Usage made it clear that availability by quarter is what buyers come back for.
What I learned. AI made generating screens fast, but speed alone wasn't the hard part. What kept six weeks from turning into chaos was the design system: it gave the AI-assisted work, and the engineers building it, a shared source of truth. The faster a team can make things, the more the foundation matters.